
Market Trends: Chapin 2025
As a real estate professional, it is important to understand the correlation between various market metrics to provide valuable insights to both buyers and sellers.
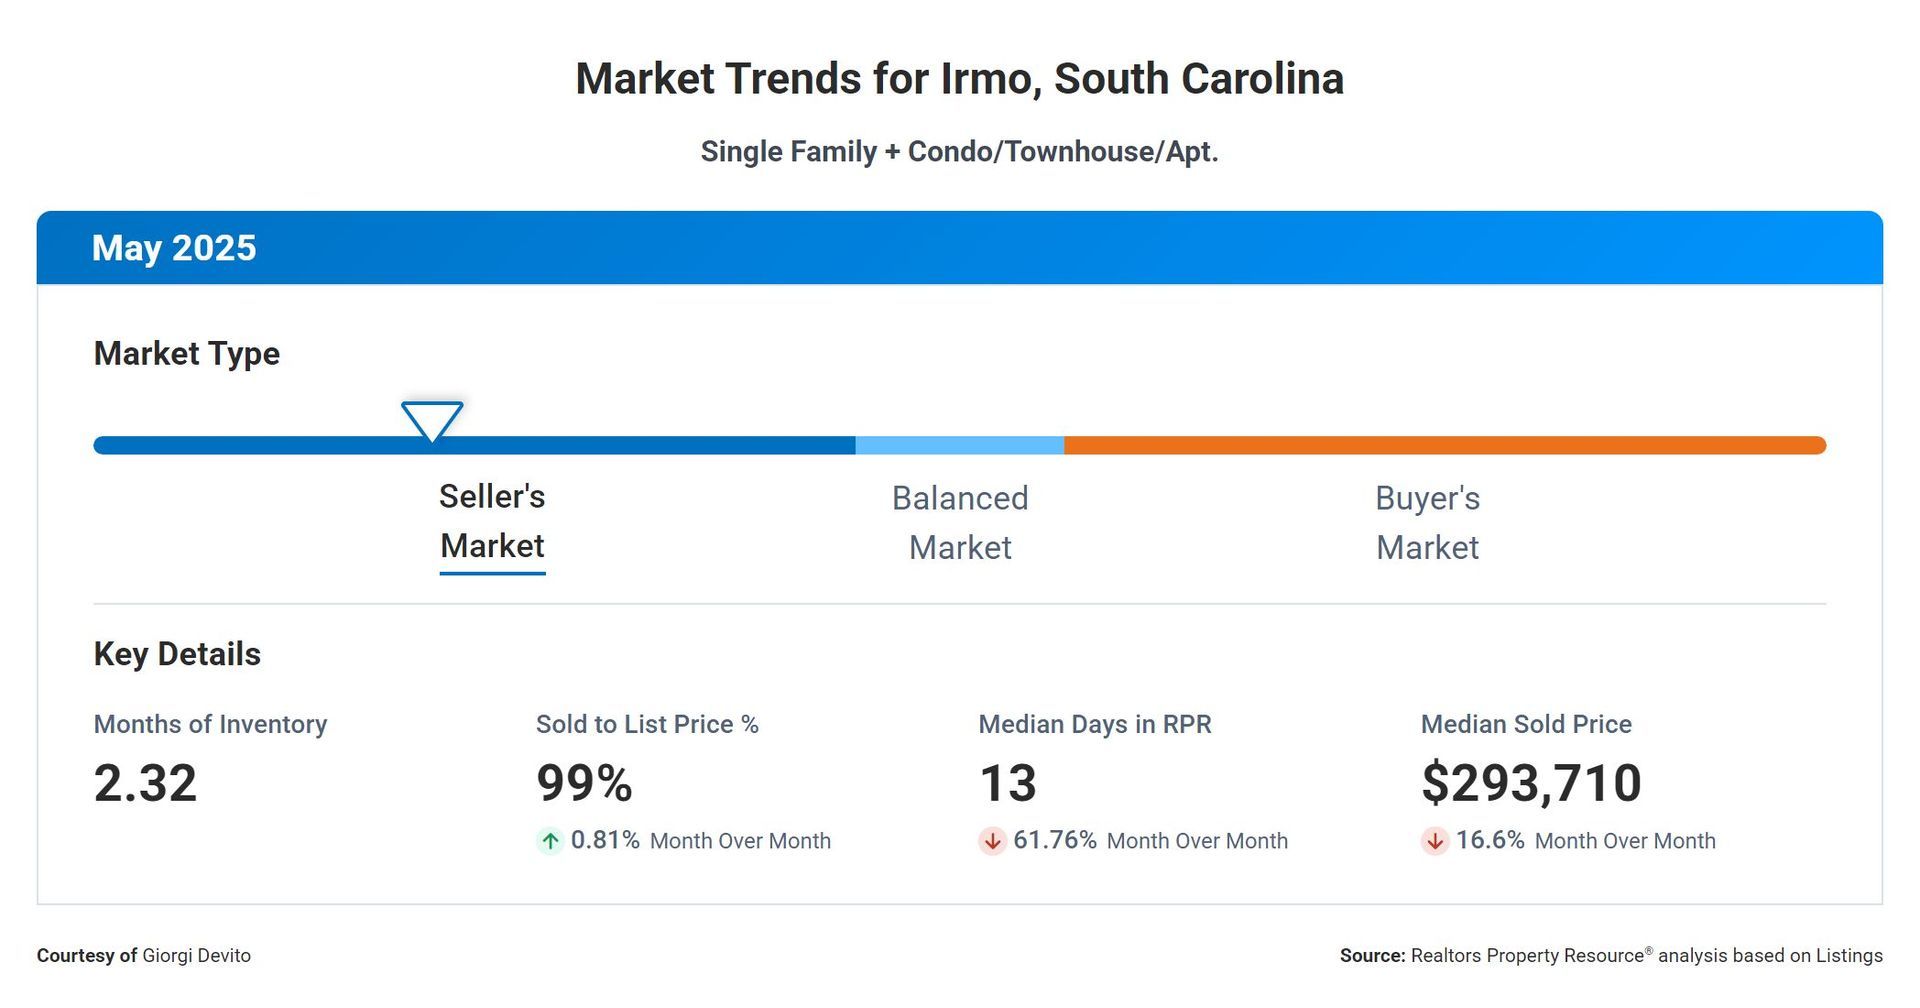
First, let's look at the Months Supply of Inventory, which currently stands at 3.27. This metric indicates how long it would take for all current listings to sell at the current sales pace. A lower months supply of inventory typically indicates a seller's market, where demand exceeds supply.
The 12-Month Change in Months of Inventory is -0.11%, showing a slight decrease in the available housing inventory over the past year. This decrease could be attributed to strong demand and limited supply, leading to a competitive market for both buyers and sellers.
The Median Days Homes are On the Market is 23, suggesting that homes are selling relatively quickly in this market. A low median days on market can indicate high buyer demand and well-priced properties.
The Sold to List Price Percentage is 0.99%, which indicates that homes are selling very close to their list price. This can be a positive sign for sellers, as it shows that they are able to achieve a high percentage of their asking price.
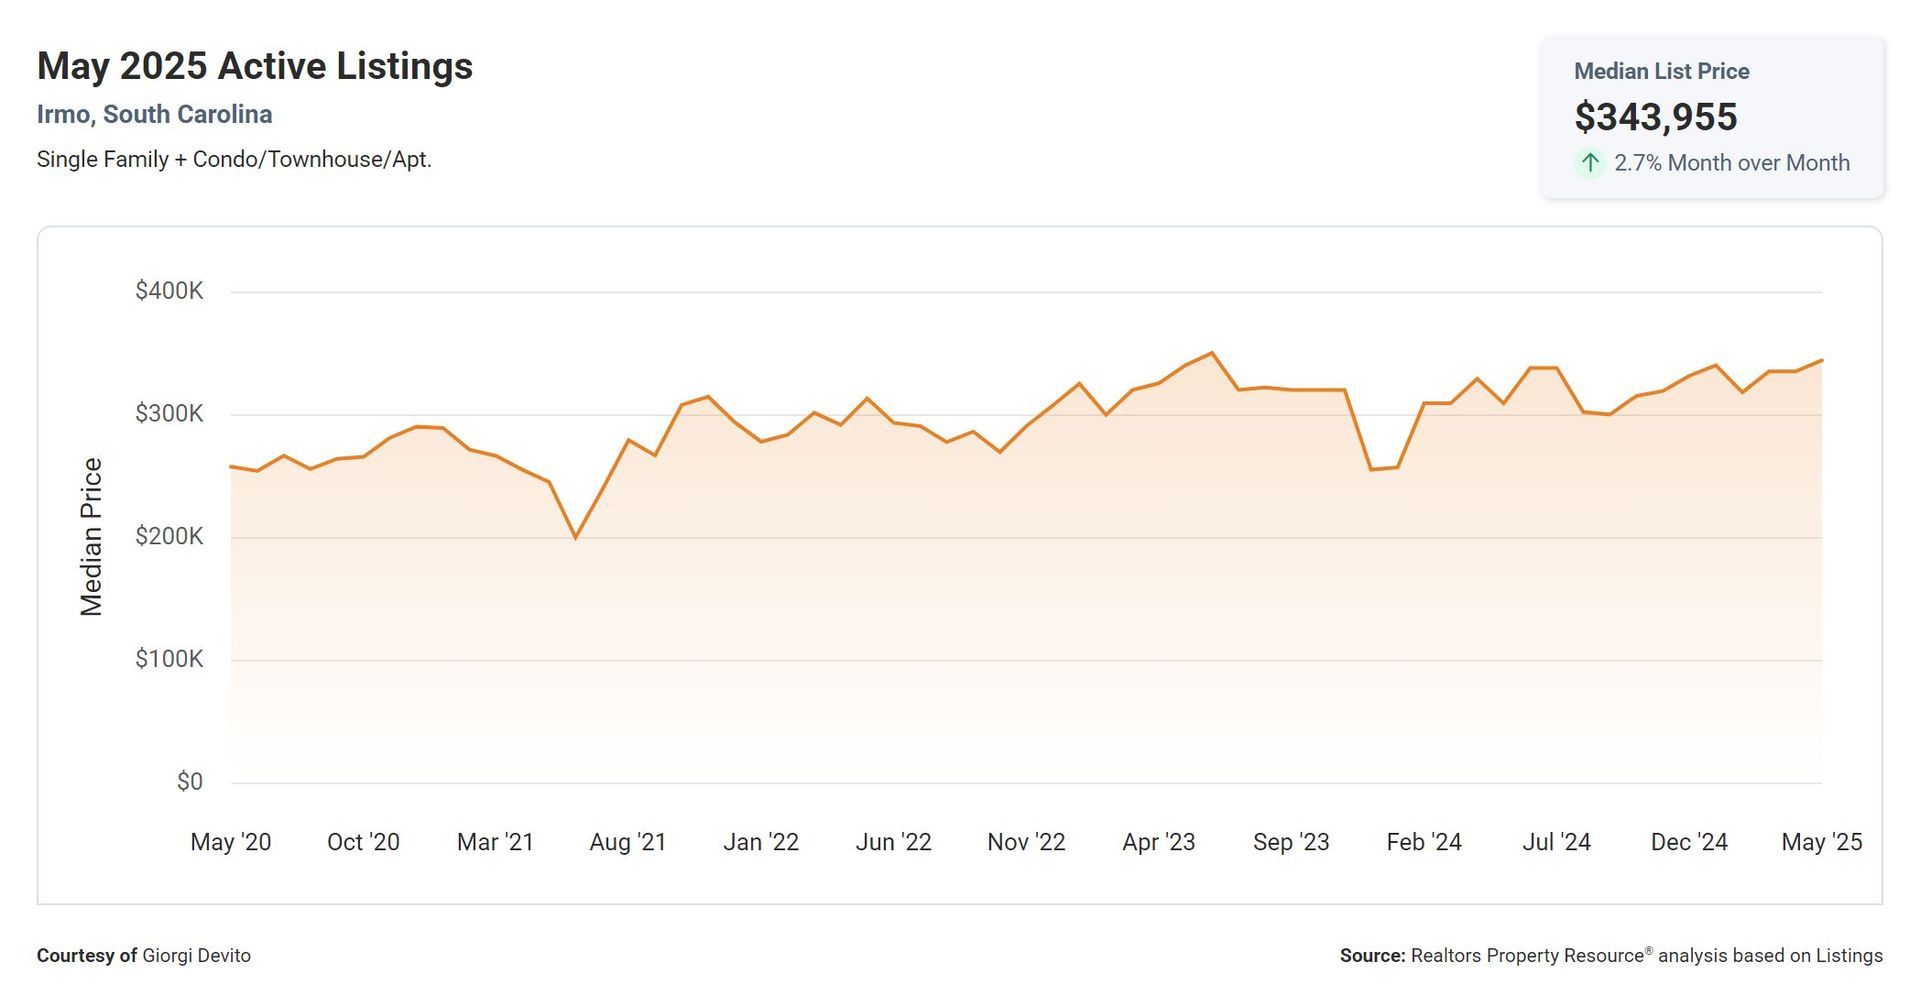
Lastly, the Median Sold Price is $395,000, giving buyers and sellers a benchmark for the average price of homes in the market. This information can help both parties make informed decisions when buying or selling a property.
Overall, these metrics paint a picture of a competitive real estate market with limited inventory, quick sales, and strong demand. Buyers may need to act fast and be prepared to make competitive offers, while sellers may benefit from pricing their homes strategically to maximize their sale price.
Contact Humberto Fonseca for All your real estate needs!